
Industry cluster analysis, in the financial benchmarking sense, groups companies by how their financial statements actually behave — common-size ratios, capital structure, margin profiles, and efficiency metrics — rather than by the activity code stamped on their tax return. The bottom line: use cluster-derived peer groups instead of raw NAICS averages whenever you need a benchmark that will hold up in a bank credit review, a valuation engagement, or a Tax Court proceeding. Tools like Bizminer give you the pre-processed, segmented financial data to run this without building a data pipeline from scratch, and validation metrics like the Silhouette coefficient tell you whether your clusters are actually meaningful before you put them in front of a client.
Table of Contents
- What is financial industry cluster analysis, and why does it beat NAICS-only benchmarking?
- What data inputs does financial clustering actually require?
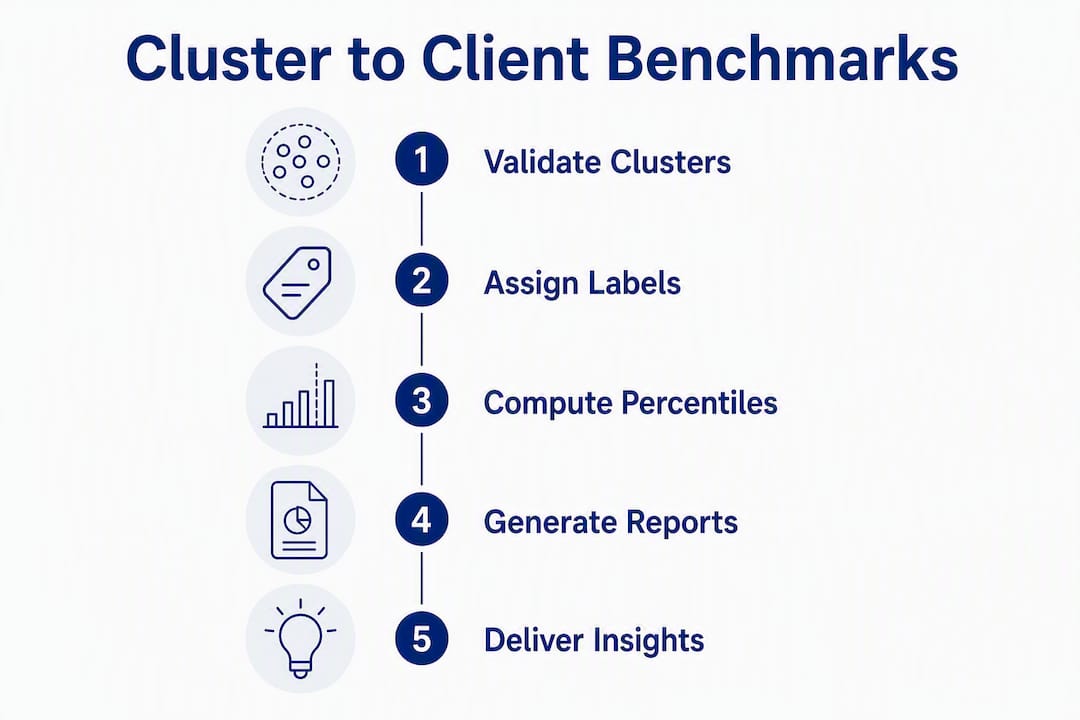
- How do you run the clustering workflow step by step?
- How do you turn cluster outputs into client-facing benchmarks?
- How does Bizminer support this work for U.S. accounting professionals?
- In-house vs. vendor implementation: what does it actually cost?
- Key Takeaways
- The case for treating clusters as a revenue architecture, not a methodology
- Bizminer gives you the data to start this week
- Useful sources
What is financial industry cluster analysis, and why does it beat NAICS-only benchmarking?
NAICS and SIC codes sort companies by what they do. Financial clustering sorts them by how they operate economically. That distinction matters more than most advisors realize.
Financial clusters built on common-size statements explain return correlations and performance patterns better than industry classifications alone. Two firms can share a NAICS code and look nothing alike financially. A specialty contractor that owns its equipment fleet carries capital intensity, depreciation drag, and leverage ratios that a labor-only subcontractor in the same code never touches. Benchmark the second firm against the first and your multiples are likely inaccurate before you start.
Why NAICS/SIC can mislead your benchmarks:
- Firms in the same code can have gross margins that differ substantially
- Capital structure varies dramatically within a single four-digit NAICS (asset-heavy vs. asset-light models)
- Working-capital cycles differ based on contract terms, not industry label
- Geographic cost structures are invisible to a national code average
Comparative example: Two NAICS 238220 (plumbing and HVAC) contractors. Firm A owns $2.1M in equipment, carries long-term debt, and runs a 38% gross margin. Firm B leases everything, has minimal debt, and runs a 54% gross margin. Same code, completely different clusters. A lender applying one benchmark to both misprices credit risk. A valuation analyst applying one EV/EBITDA multiple to both misstates value.
| Dimension | NAICS/SIC Classification | Financial Cluster |
|---|---|---|
| Basis | Business activity code | Common-size financial ratios |
| Peer accuracy | Broad, often mixed | Tight, economically similar |
| Valuation defensibility | Moderate | High (court and bank contexts) |
| Margin for error | Wide | Narrow |
| Update frequency | Infrequent | Refreshable with new data |
What data inputs does financial clustering actually require?
The quality of your clusters is entirely determined by what you feed them. Garbage ratios produce clusters that look statistically clean but mean nothing economically.
Primary inputs to collect:
- Income-statement common-size ratios: gross margin, operating margin, EBITDA margin, SG&A as a percent of revenue
- Balance-sheet common-size ratios: total debt to assets, equity ratio, fixed assets as a percent of total assets
- Cash-flow ratios: operating cash flow to invested capital, free cash flow margin
- Activity ratios: receivables turnover, inventory turnover, working-capital turnover
- Leverage and coverage: interest coverage, debt service coverage ratio
- Size and age variables: revenue band, years in operation, employee count band
Practitioners should prefer common-size ratios as clustering features because they strip out scale effects and expose structural differences like capital intensity or margin architecture. A $500K revenue firm and a $5M revenue firm can belong to the same cluster if their cost structures are proportionally identical.
Data preprocessing is non-negotiable. Winsorize outliers at the 1st and 99th percentiles before clustering, or a handful of distressed firms will pull cluster centroids into meaningless territory. Handle missing values by imputation or exclusion, not by leaving them blank. Align time windows: mixing one firm’s trailing-twelve-month data with another’s fiscal-year-end data introduces noise that no algorithm can fix.

Geography and size bands matter as metadata, not as clustering variables. Use them to filter your input universe before you cluster, not as dimensions inside the algorithm. A national benchmark for HVAC contractors is less useful than a Southeast regional benchmark for HVAC contractors with $1M–$5M in revenue.
Pro Tip: Run your clustering on a minimum of three years of averaged ratios per firm, not a single year’s snapshot. Single-year data amplifies cyclical noise and produces unstable clusters that shift dramatically quarter to quarter.
How do you run the clustering workflow step by step?
The workflow has six stages. Each one has a failure mode worth knowing.
- Data collection. Pull common-size financials, activity ratios, and size metadata for your target universe. For U.S. advisory work, Bizminer’s market and industry research datasets cover thousands of markets and come pre-segmented by industry, geography, and revenue band.
- Preprocessing. Common-size every ratio, winsorize outliers, impute or drop missing values, and standardize (z-score) all features so no single ratio dominates by scale.
- Dimensionality reduction. Run PCA or factor analysis to collapse correlated ratios into orthogonal components. Aim to retain 80–90% of variance in three to six components. This step prevents the “curse of dimensionality” that makes distance metrics unreliable in high-dimensional ratio spaces.
- Clustering. Choose your algorithm based on your use case (see below). Run multiple solutions (k=3 through k=8 is a reasonable sweep) and score each.
- Validation. Score every solution with the Silhouette coefficient, test cluster stability by re-running on subsamples, and confirm that each cluster has an economic interpretation a client can understand.
- Peer selection and labeling. Assign new clients to clusters using k-nearest-neighbors on the same feature space. Label each cluster descriptively (“high-margin, asset-light services” or “capital-intensive, moderate-leverage manufacturing”) before any client-facing output.
Algorithm tradeoffs at a glance:
- K-means: Fast, interpretable centroids, assumes spherical clusters. Works well when your ratio space is reasonably compact.
- Hierarchical/agglomerative: Produces a dendrogram you can show a skeptical partner. Slower at scale but excellent for smaller universes (under 500 firms).
- Spectral clustering: Handles non-convex cluster shapes. Spectral and agglomerative methods applied to corporate financials reduce subjectivity and speed peer selection for private-company comparables.
- Gaussian mixture models: Assigns soft probabilities, useful when a firm sits near a cluster boundary and you want to flag the ambiguity rather than force a hard assignment.
Pro Tip: Aim for a minimum of 3–10 true peers per subject firm after cluster assignment. Fewer than three peers and your benchmark percentiles are statistically meaningless; more than ten starts to dilute the economic similarity you worked to create.
“A defensible clustering process combines statistical validation — silhouette scores, stability tests — with domain review. Every cluster label needs an economic interpretation before it becomes a client benchmark.” — Systematic Comparable Company Analysis and Computation of Cost of Equity using Clustering
How do you turn cluster outputs into client-facing benchmarks?
Once clusters are validated and labeled, the translation to advisory deliverables is straightforward. The hard work is already done.
Benchmark tables. For each cluster, compute the 10th, 25th, 50th, 75th, and 90th percentile for every key ratio. Your client’s ratios drop into those percentile bands. A gross margin sitting relatively low in their cluster is a conversation starter. The same number against a broad NAICS average might look fine.
Valuation inputs. Using cluster-derived peers to compute cost of equity via average beta or CAPM yields more accurate private-company estimates than broad industry averages. Pull the public-company proxies that fall in the same cluster, average their unlevered betas, re-lever for the subject’s capital structure, and you have a defensible cost-of-equity input for a DCF. The same peer set drives your EV/EBITDA and EV/Revenue multiples.
Top-20% opportunity reports. Top-20% benchmarking identifies the specific ratios where a client trails the top performers in their cluster and quantifies the dollar impact of closing that gap. One webinar case study cited a specific profit-improvement opportunity identified through this method. That number, presented in a one-page report, is a more compelling advisory conversation than any compliance deliverable.
Deliverable menu for advisors:
- Cluster-based ratio scorecard with percentile rankings
- Top-20% gap analysis with revenue and margin impact estimates
- Peer-derived valuation range (EV/EBITDA, EV/Revenue, SDE multiples)
- Working-capital optimization playbook tied to cluster median targets
- Scenario-based DCF with cluster-calibrated discount rate and growth assumptions
Narrative reports paired with five-year projections and DCF valuations are the standard advisory package that converts a one-time benchmarking engagement into a recurring relationship.
How does Bizminer support this work for U.S. accounting professionals?
Bizminer is built for exactly this workflow. Its data is accepted in U.S. Tax Court, used by government agencies and academic institutions, and sourced from transparent public and private datasets — which means the benchmarks you build on it carry the provenance documentation that banks, courts, and buyers’ counsel actually ask for.
What the platform gives you:
- Pre-segmented financials across 9,000+ unique markets, sliced by NAICS, geography, and revenue band
- Common-sized income statements and balance sheets ready for ratio extraction
- Exportable ratio matrices that feed directly into a clustering pipeline
- Customizable report templates that map cluster outputs to client-facing formats
- API access for firms that want to automate cluster assignment for new clients
- One-off custom reports for single-engagement needs without a full subscription
Pro Tip: Use Bizminer’s custom report builder to pull a ratio matrix for a specific NAICS code, geography, and revenue band before you cluster. Pre-filtered data cuts preprocessing time significantly and reduces the outlier problem before it starts.
The platform’s subscription tiers serve individual practitioners through enterprise teams, and prospect lists are available as add-ons for firms that want to use cluster profiles to identify new client targets in underserved segments.
In-house vs. vendor implementation: what does it actually cost?
| Approach | Timeline | Primary Cost Drivers |
|---|---|---|
| In-house build | 6 months to production | Engineering time, data licensing, compute, validation review |
| Vendor/outsourced | 4–8 weeks to pilot | Licensing fees, template customization, integration work |
| Hybrid (vendor data, in-house model) | 8 weeks | Data licensing, analyst time, model validation |
Pilot to production timeline:
| Stage | Duration | Key Deliverable |
|---|---|---|
| Pilot (single industry) | 4–8 weeks | Validated cluster solution, labeled peer groups |
| Production build | 3–6 months | Full pipeline, report templates, client assignment workflow |
| Ongoing maintenance | Quarterly | Cluster stability review, ratio refresh, new-client onboarding |
The biggest cost most firms underestimate is validation and legal review. If you plan to use cluster-based benchmarks in a defended valuation, a loan covenant package, or a Tax Court submission, you need documented methodology, stability logs, and a qualified reviewer. Budget for that before you budget for compute.
Start with one industry where you have five or more active clients. A single-industry pilot costs a fraction of a full build, produces a usable deliverable in weeks, and gives you the proof-of-concept to justify broader investment.
Key Takeaways
Financial-behavior clustering produces tighter, more defensible peer groups than NAICS/SIC classification alone, and the workflow is implementable in weeks with the right data source.
| Point | Details |
|---|---|
| Cluster on financials, not codes | Common-size ratios reveal economic structure that NAICS codes obscure, producing tighter peer groups. |
| Validate before you deliver | Use the Silhouette coefficient and stability testing; every cluster needs an economic label before client use. |
| Top-20% reports drive revenue | Gap analysis against cluster top performers converts a benchmark into a recurring advisory conversation. |
| Start with a single-industry pilot | One focused pilot (4–8 weeks) proves the method and justifies broader investment across your client base. |
| Bizminer accelerates the workflow | Pre-segmented financials across 9,000+ markets, with court-accepted provenance, cut data prep from months to days. |
The case for treating clusters as a revenue architecture, not a methodology
The conventional framing of financial clustering is methodological: better statistics, tighter peers, more defensible comps. That framing undersells it.
The real opportunity is structural. When you assign a client to a cluster, you know exactly which ratios they need to improve to reach the top 20% of their peer group. You know what that improvement is worth in dollars. You know which valuation multiples apply to firms at their current performance level versus the level they could reach. That is not a one-time deliverable. That is a monitoring relationship.
Firms that package cluster benchmarks as annual or semi-annual check-ins, with updated percentile rankings and a revised gap analysis, are selling something clients will renew. The compliance billing model is transactional by design. Cluster-based advisory is relational by design, because the benchmark only gets more useful as the client’s data accumulates over time.
The other underused application is prospecting. A cluster profile for “high-margin, asset-light professional services firms in the $2M–$5M revenue band” is also a prospect description. Bizminer’s prospect lists let you find firms that match a cluster profile before they are clients, which turns your benchmarking methodology into a business development tool.
Advisors who convert cluster insights into Top-20% opportunity reports move clients from compliance billings to recurring advisory retainers by showing concrete profit and valuation levers. The methodology is the product. Sell it that way.
Bizminer gives you the data to start this week
Firms that want granular, court-accepted financial benchmarks across 9,000+ U.S. markets don’t need to build a data pipeline first. Bizminer delivers pre-segmented, common-sized financials by NAICS code, geography, and revenue band, ready to feed a clustering workflow or a custom advisory report.

Whether you need a subscription dataset for ongoing cluster maintenance, a one-off custom industry report for a single valuation engagement, or an API feed to automate peer assignment at scale, Bizminer has a path that fits your firm’s current capacity. Prospect lists are available as add-ons for firms ready to turn cluster profiles into a pipeline. Start your pilot with Bizminer’s market and industry research and have a validated cluster solution in front of your first client within weeks.
Useful sources
- Systematic Comparable Company Analysis and Computation of Cost of Equity using Clustering — methodology paper on spectral and agglomerative clustering for private-company comparables and cost-of-equity estimation
- Financial clusters, industry groups, and stock return correlations — academic research showing financial clusters explain return correlations better than industry codes alone
- An efficient graph-based peer selection method for financial statements — graph-based approach to peer selection using financial statement data as an alternative to classification systems
- Deriving National Industry Cluster Templates for Regional Cluster Analysis — NAICS-based methodology update for national cluster template derivation
- Business Financial Benchmark Analysis — Burke Advisory — deliverable descriptions for narrative reports, projections, and DCF valuations paired with benchmarking